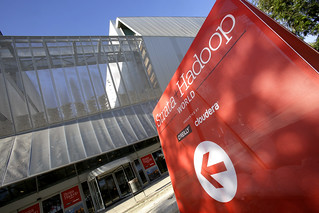
I am totally overwhelmed by the impressions I got as a first timer at a Strata Europe conference, which was this year from 19 November to 21 November in Barcelona. The seven(!) different tracks included talks of high quality covering topics from a theoretical standpoint as well as an architectural and tooling view. The most interesting talks for me personally however were those in which the speakers shared their experiences about the real world application of the presented concepts.

As a perfect starting point I joined the D3 tutorial by Sebastian Gutierrez (DashingD3js.com). There I learned the basics of how D3 works, which enables me now to understand and possibly customize all the libraries that are built on top.
Following up with the talk of Simon Worgan (Jagex Ltd) & Samuel Kerrien (RESEREC) I was intrigued by their presentation of a bi-directional recommender system. This is definitely a topic I am following up on given that I played around with recommendation myself (see my earlier blog post about collaborative filtering).
Inspired by the slide deck of Dan McKinley about Data driven products at Etsy I was happy to join Melissa Santos’ talk about Etsy’s way of making data accessible to EVERYONE in the company. She shared stories of how product managers stopped the development team from shipping code that did not include the respective tracking functionality because the product managers themselves write Scalding (Hadoop) jobs to get data about the shipped features.
As a fan of Google Docs I was surprised to find out that it is possible to use Google Docs as a front-end of a Data Warehouse and thus enabling management to get daily updates of the most important metrics directly from the source – thank you Aaron Frazer (Seeking Alpha) for sharing this!
I collected more knowledge about data visualization: from a tooling perspective via a talk about ggvis by Garrett Grolemund (RStudio) and from a communication viewpoint via a talk about storytelling and animation by Michael Freeman (Institute for Health Metrics and Evaluation, University of Washington). The latter showed the following impressing data visualization: U.S. Gun Deaths.
I also learned about Duke, an open source tool to deduplicate data with a “self configuration” option, and about graphlab, a commercial tool that tries to close the gap between prototyping and productionizing predictive apps (which seemed worth trying).
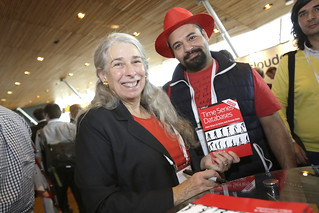
Of course the sponsors brought all kinds of nice goodies but the most useful ones – in my opinion – were the O’Reilly books signed by the authors. Depicted here is Ellen Friedman from our partner company MapR signing the book “Time Series Databases” (available for download here).

All these impressions completely reinforced my reasons of attending conferences: Everytime I go to a conference (now it’s tech related, during my studies it was AIESEC related) I come out with even more inspiration, motivation, knowledge and contacts. With this spirit lifting I wish I could go to a conference every week, however that would be too time consuming. Good thing that there are meetups in which I can get close to this conference feeling.
I’m looking forward to the meetups about Big Data in Munich (see http://bigdata.comsysto.com/). Feel free to join me!