Currently, the Hadoop based software company Cloudera creates the new certification called Data Science Essentials Exam (DS-200). One goal of the certification is to learn tools, techniques, and utilities for evaluating data from the command line. That’s why I am writing this blog post. The Unix shell provides a huge set of commands that can be used for data analysis. A good introduction to Unix commands can be found in this tutorial.
The data analyst friendly commands are: cat, find, grep, wc, cut, sort, uniq
This commands are called filters. Data passes through a filter. Moreover, a filter can modify data a bit on the way through them. All filters read data from the standard input and writes data to standard output. Filter can use the standard output of another filter to be its standard input while using the pipe “|” operator. E.g. the cat command reads a file to standard output and the grep command uses this output of cat as standard input to search if the city ‘Munich’ is in a city file. The example dataset is available on github.
github:ff356a31af72675f38c9
In the example above you can see the structure of the sample data set. The dataset is a comma separated list. The first number represents the id of an entry, followed by the name of a city, the countrycode, district and the last number represents the population of a city.
Now, let’s answer an analytical question: What is the city with the biggest population in the data set? The second and the fifth column can be selected with the help of awk. Awk creates a list where the population is on the first position and the city name is on the second position. Thesort command can be used for sorting. Therefore, it is possible to find out which city in the dataset has the biggest population.
github:82e22d5c7f22f058dfae
It is also possible to make joins in the Unix shell with the command called join. The joincommand assumes that input data is sorted based on the key on which the join is going to take place. You can find another dataset on github which contains countries. This dataset is a comma separated list as well. The 14th column in the country dataset represents the capital id which is similar to the id in the city data set. This makes it possible to create a list of countries with their capitals.
github:3ed999b3d63cad2a5301
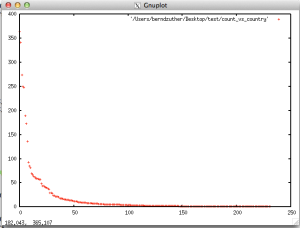
Finally, let’s get a deeper look in the city data set. The question for this example is: How is the distribution of cities in the city data set? A combination of the sort and the uniq commands allows us to create data for a density plot. This data can be streamed (>) to a file.
github:0a542148cbf65ec9f133
Gnuplot is a command which allows us to visualize the density data file. We have to tell gnuplotwhat it has to print and how it should be printed. You can use gnuplot while telnet or ssh session as well because plots can be printed in ACSII-Characters. Therefore, the terminal type has to be set to ‘dumb‘.
github:09eefb66deb8c9b7e0b2
I hope you enjoyed this little excurse in data analysis with the Unix shell. It is useful for students which are currently working on the study guide of Data Science Essentials (DS-200) Beta. Furthermore, I demonstrated how powerful the Unix shell can be used for basic analytics. The Unix shell is also able to do basic things like an analyst normally is executing in a statistical software as R.